Window Functions in SQL: The BI Developer's Cheat Sheet for Running Totals and Rankings
ROW_NUMBER, RANK, LAG, running totals, year-over-year — the window function patterns that replace almost every self-join in BI reporting SQL.
Practical notes on Power BI, DAX and enterprise BI delivery — from projects across Singapore, Qatar, USA and India.
ROW_NUMBER, RANK, LAG, running totals, year-over-year — the window function patterns that replace almost every self-join in BI reporting SQL.
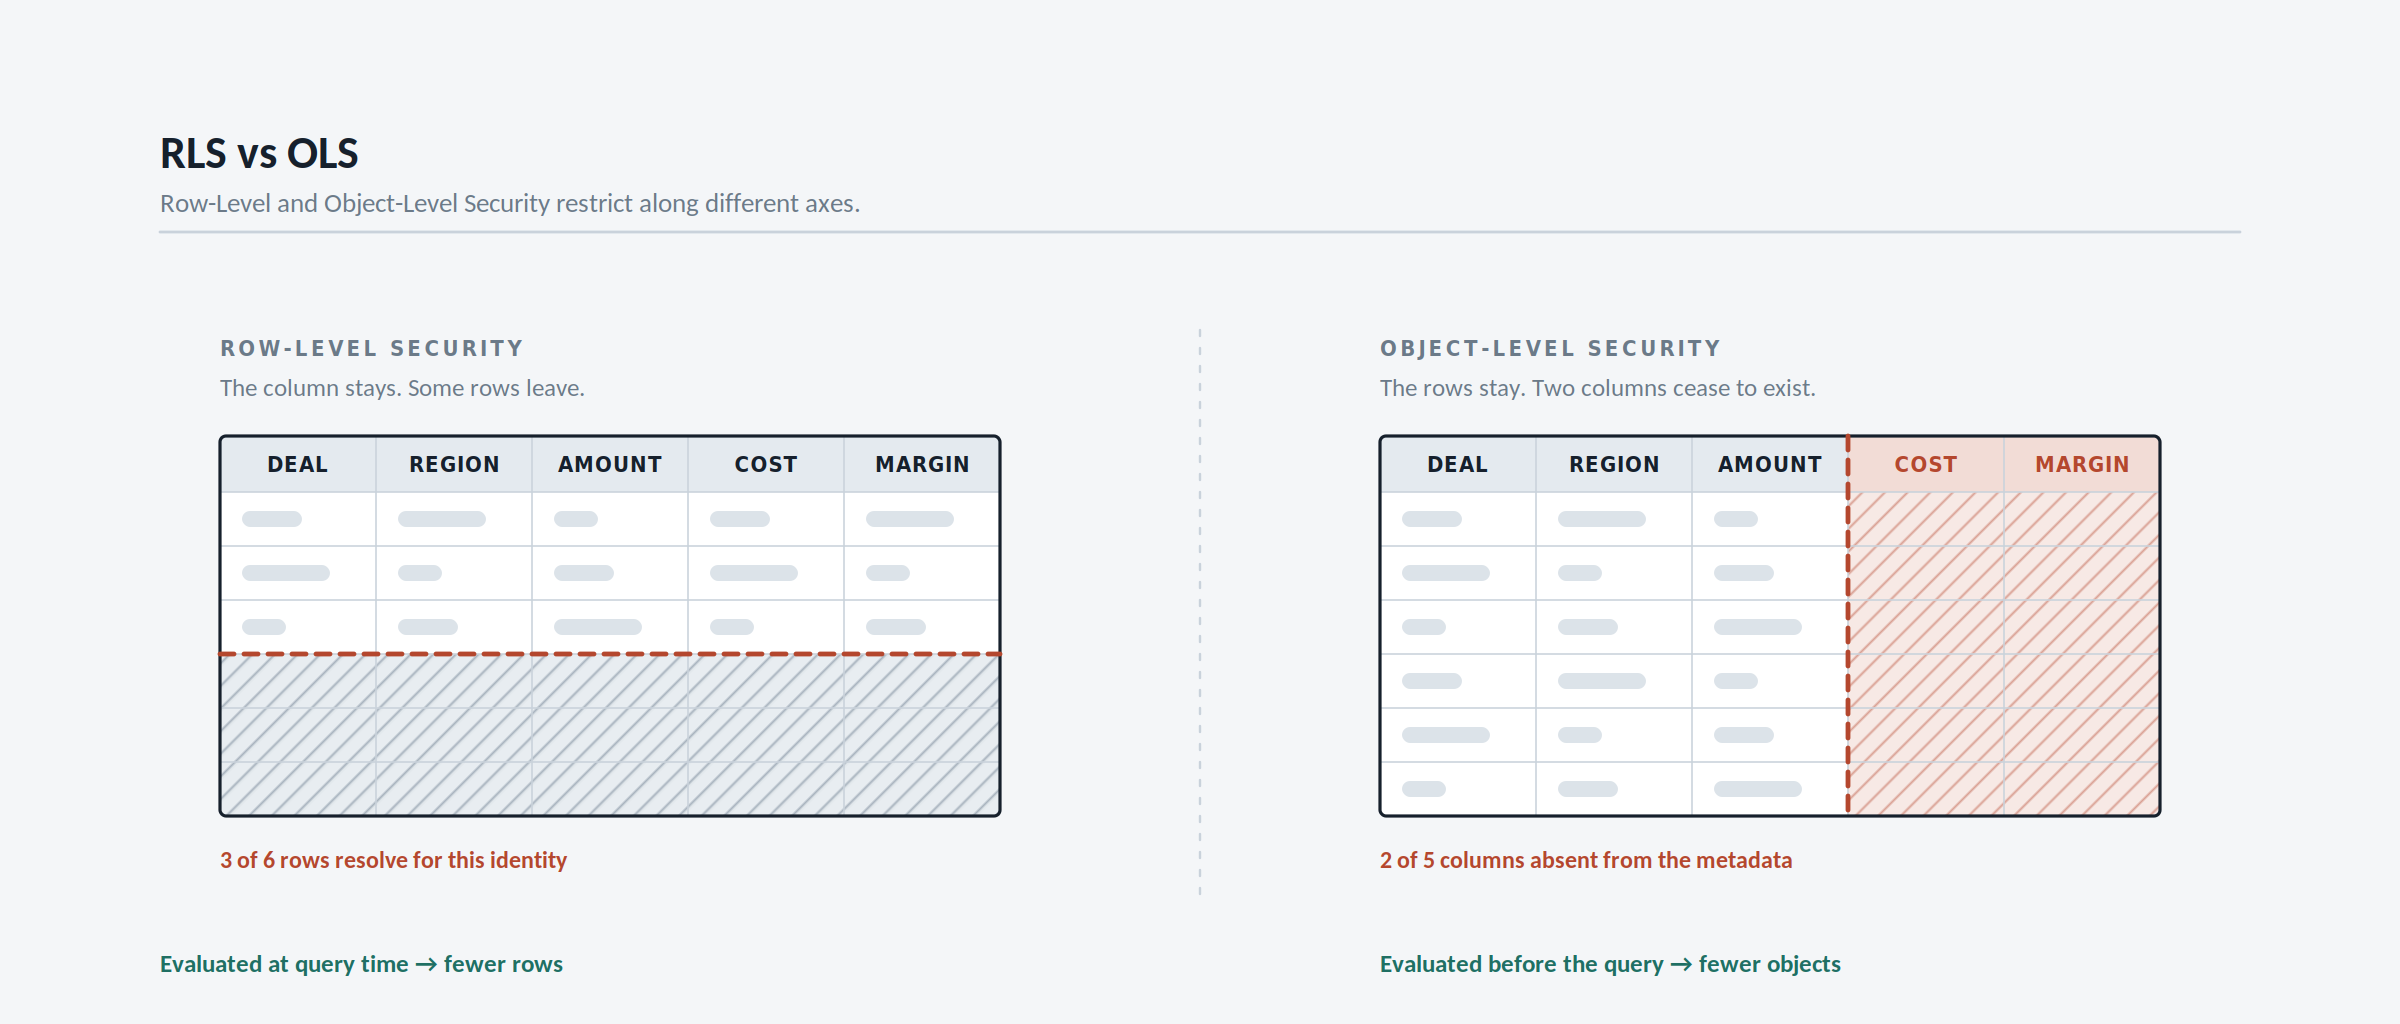
Row-Level Security and Object-Level Security get used interchangeably, but they restrict along different axes and fail in different ways. A practical walkthrough of dynamic RLS, OLS via Tabular Editor, the bidirectional relationship trap, and pushing security down into the Fabric Warehouse.
Your Year-over-Year measure works perfectly all year — until the fiscal year rolls over, and the comparison quietly starts pulling the wrong period. Here's why calendar-based time intelligence functions and fiscal calendars don't mix the way most people assume.
The model isn't self-explanatory — it's self-explanatory to the one person who built it, for exactly as long as they remember why.
Authenticating to NetSuite, paging past the 1000-row API cap, and landing data cleanly in a Fabric Lakehouse — a practitioner's walkthrough of the defaults and gotchas that cost real time, and how to sidestep each one.
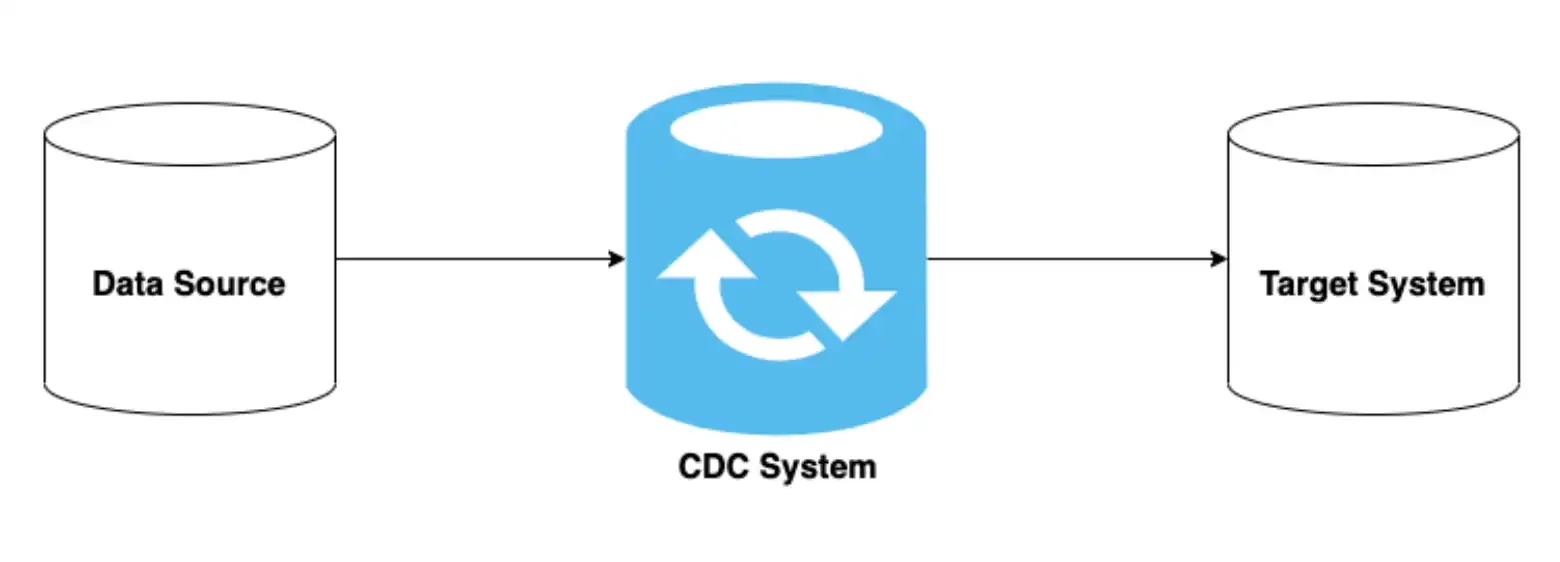
Full Load, Incremental Load, and CDC aren't just three options — each has a specific failure mode most pipelines hit eventually. Here's the incremental load filter mistake that quietly excludes legitimate updates, and why CDC exists to solve exactly this.
Stop guessing why your query is slow — read the execution plan in the right order and spot the patterns that actually kill BI performance.
Warehouse, lake, and lakehouse are three different answers to who can write, who can read, and what breaks if both happen at once.
Every visual in a DirectQuery report is a live round trip to the source - stack enough of them and real-time becomes the slowest thing on the page.
A hardcoded cutoff date works perfectly in every demo, then quietly breaks the report the first month nobody remembers to update it.
A step-by-step guide to blending actuals and forecast data in Power BI using a single master DAX measure — handling mixed-period quarters, stacked bar charts, product breakdowns, and drillthrough row inflation using ISINSCOPE and SWITCH(TRUE()).
A published Fabric Data Agent gives you two programmatic surfaces: the new MCP server endpoint and the older Published URL / Python client SDK. They return the same grounded answers, so it's easy to pick the wrong one. Here's how they actually differ, why authentication — not transport — decides your architecture, and which path belongs behind a front-end app.